Licensing
Description
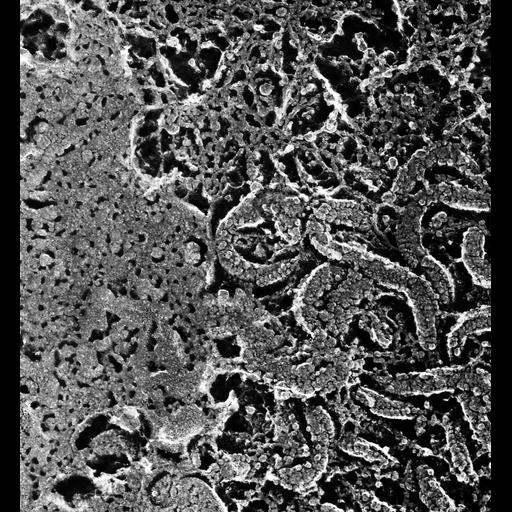
High magnification view of a crushed mitochondrion showing the zipper-like row of 9nm diameter particles on the outer curve of the cristae and the single row of larger particles on the inner curve. There is an average of 1500 particles per square micrometer of 50-nm tubular cristae surface on the outer curve. These particles are thought to be the F1 units of the F1F0 ATP synthases of the mitochondria. The larger particles on the inner curve resemble complex I of the respiratory electron transport chain in size and relative abundance when compared to their relative quantities estimated from biochemical studies in other cells such as beef heart. This shows the highly ordered arrangement of some of the molecules of the oxidative phosphorylation and electron transport systems in Paramecium. TEM taken on 5/6//88 by C. Schroeder with Zeiss 10A operating at 80kV. Neg. 63,000X. The raw negative was scanned with an Epson Perfection V750 Pro and this high resolution image is best used for quantitative analysis. Additional information available at (http://www5.pbrc.hawaii.edu/allen/). Published in J. Cell Biol. 108:2233-2240, 1989. Adapted with permission.
Biological Sources
- NCBI Organism Classification
- Paramecium multimicronucleatum
- Cell Type
- cell by organism
- eukaryotic cell
- Eukaryotic Protist
- Ciliated Protist
- Cellular Component
- mitochondrial proton-transporting ATP synthase complex, catalytic core F(1)
- mitochondrion
Biological Context
- Biological Process
- regulation of mitochondrion organization
Attribution
- Names
- Richard Allen (University of Hawaii)
- C. Schroeder
- Published
- J Cell Biol. 1989 Jun;108(6):2233-40.
- Link
- http://www5.pbrc.hawaii.edu/allen/
- Pubmed
- 2525561
Grouping
This image is part of a group.Imaging
- Image Type
- transmission electron microscopy (TEM)
- illumination by electrons
- Imaging Mode
- electron density
- Parameters Imaged
- elastic scattering of electrons
- electron density
- elevation
- Source of Contrast
- differences in deposition of metal shadow
- Visualization Methods
- transmission electron microscopy (TEM)
- Processing History
- freeze_fracture/freeze_etch
- shadowing and plating
- recorded image
- film
- Data Qualifiers
- raw, unprocessed data
- suitable for spatial measurements
Sample Preparation
- Methods
- freeze_fracture/freeze_etch
- Relation To Intact Cell
- shadowing and plating
- freeze_fracture/freeze_etch
- isolated subcellular component
Dimensions
| Spatial Axis | Image Size | Pixel Size |
|---|---|---|
| X | 3726px | 0.32nm |
| Y | 4048px | 0.32nm |