Alternate header for print version


Licensing
Public Domain: This image is in the public domain and thus free of any copyright restrictions. However, as is the norm in scientific publishing and as a matter of courtesy, any user should credit the content provider for any public or private use of this image whenever possible. Learn more
tweet  
*CIL – Cell Image Library accession number. Please use this to reference an image.

CIL:40400*  Cite 
Description

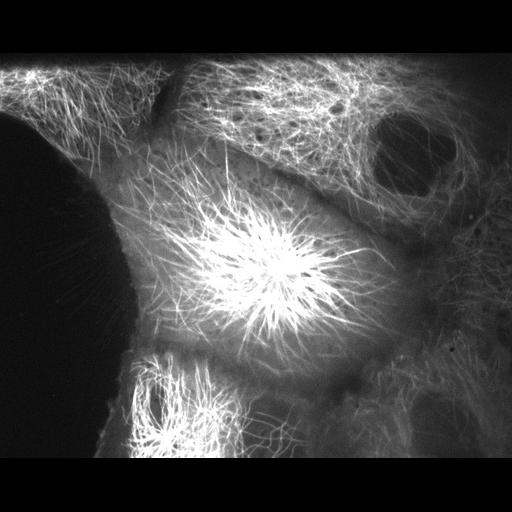
Stack of time series images showing the change in microtubule distribution in cultured porcine kidney epithelial cells (LLCPK1) stably expressing GFP-alpha tubulin during the progression from prophase to prometaphase. The cytoskeleton is reorganized with disassembly of individual microtubules and formation of microtubule bundles, causing an inward collapse of the microtubule array prior to the formation of the mitotic spindle. A movie created from the stack is grouped with the image.

Technical Details

Living LLCPK1 cells expressing GFP-alpha-tubulin were observed using a Nikon Eclipse TE 300 microscope equipped with a 100x phase NA 1.4 objective lens, and images captured at 2 sec intervals with a Perkin Elmer spinning disc confocal scan head and a cooled CCD camera See also NM Rusan et al. 2002 Reorganization of the microtubule array in prophase/prometaphase requires cytoplasmic dynein-dependent microtubule transport. J Cell Biol 158:997-1003.

Biological Sources
NCBI Organism Classification
Sus scrofa domestica
Cell Type
kidney epithelial cell
Cell Line
LLC-PK1
Cellular Component
microtubule
microtubule cytoskeleton
Biological Context
Biological Process
mitosis
microtubule cytoskeleton organization
Attribution
Names
Nasser Rusan
Patricia Wadsworth
Citation
Digital Object Identifier (DOI)
doi:10.7295/W9CIL40400
Archival Resource Key (ARK)
ark:/b7295/w9cil40400
Grouping This image is part of a group.
Imaging
Image Type
charge coupled device (CCD)
Image Mode
spinning disk confocal microscopy
Parameters Imaged
fluorescence emission
Source of Contrast
distribution of a specific protein
Visualization Methods
EGFP
Data Qualifiers
processed data
Sample Preparation
Methods
living tissue
Relation To Intact Cell
whole mounted tissue
Dimensions
Spatial Axis Image Size Pixel Size
X 650px ——
Y 515px ——
Time 2 seconds 253