Investigation of astrocyte morphology and the establishment of unique astrocytic domains
Funding agency
NIH
Leader(s)
Eric Bushong
Collaborator(s)
Maryann Martone and Mark Ellisman
Start date
09-01-1999
End date
09-01-1999
Experiment
Experiment ID
16
Experiment date
01-01-2000
Title
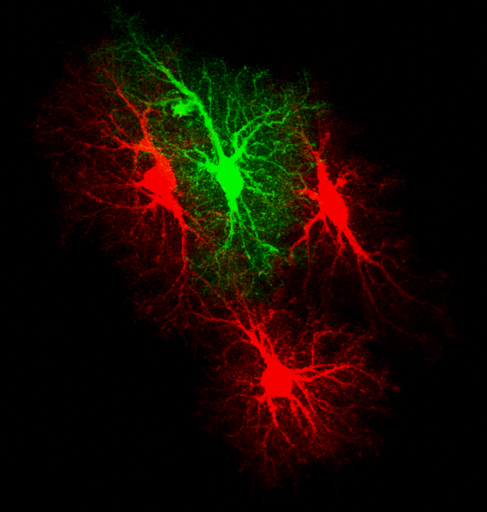
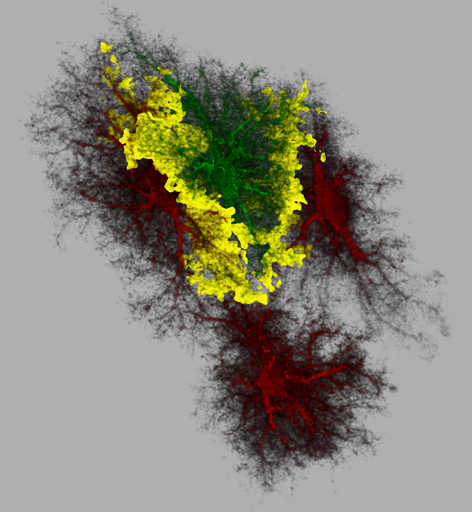
Astrocyte overlap using two color injection
Purpose
Extent of overlap of domains of two neighboring astrocytes in CA1
Experimenter(s)
Eric Bushong
Microscopy product
Microscopy product ID
28
Instrument
Biorad Radiance 2000 Confocal
Microscopy type
confocal
Product type
optical section series
Image basename
grp2
Spatial Axis
Image Size
Pixel Size
X
1024px
0.14 µm
Y
1024px
0.14 µm
Subject
Species
rat
Scientific name
rattus norvegicus
Strain
Sprague Dawley
Treatment
none
Age
1 months
Age class
adult
Tissue section
Anatomical location
hippocampus
Microtome
vibratome
Thickness
100 µm
Specimen description
Organ
brain
System
central nervous system
Cell type
protoplasmic astrocyte
Imaging parameters
Type
Light microscopy product
Immersion medium
oil
Mounting medium
gelvatol
Lens magnification
X
Numerical aperture
1.4
Specimen preparation
Protocol used
Intracellular fills of astrocytes with fluorescent dyes in fixed tissueThe method for filling cells in fixed tissue slices was adapted from previously reported protocols (Buhl, 1993; Belichenko and Dahlstrm, 1995). Male Sprague-Dawley rats, one month of age, were anesthetized with an overdose of Nembutal (10 mg / 100 g body weight) and perfused transcardially with oxygenated Ringer's solution at 37C (0.79% NaCl, 0.038% KCl, 0.020% MgCl26H2O, 0.018% Na2HPO4, 0.125% NaHCO3, 0.030% CaCl22H2O, 0.20% dextrose, 0.020% xylocaine) for about 30 seconds, followed by 0.1 M phosphate buffered saline, pH 7.4 (PBS) containing 4% paraformaldehyde (37C). For electron microscopic studies, 0.1% glutaraldehyde was added to the fixative. The fixative was perfused through the body for 10 minutes, at which point the brain was removed and cut on a vibratome into 100-m thick coronal slices. The slices were stored in ice-cold PBS and used within 48 hours. The slices were placed in cold PBS and viewed with an Olympus BX50WI infrared differential interference contrast/epi-fluorescent microscope (Olympus, Melville, NY), using a 60x water immersion objective. Sharp glass micropipettes were pulled on a vertical pipette puller (David Kopf Instruments, Tujunga, CA) using omega-dot capillary tubes (OD 1.00 mm, ID 0.58 mm; resistances ranged between 100 and 400 M?) and back-filled with either 10 mM Alexa Fluor 568 in 200 mM KCl, 10 mM Alexa Fluor 488 in 200 mM KCl (Molecular Probes, Eugene, OR), or 5% aqueous dilithium Lucifer Yellow CH (LY) (Calbiochem, La Jolla, CA). The astrocytes were identified by the distinctive size and shape of their soma. The somata were impaled and the dye was injected into the cells by applying a 0.5-second negative current pulse (1 Hz) until the processes were completely filled. After several cells were filled in a tissue slice, the slice was placed in cold 4% paraformaldehyde/PBS for about 30 minutes. At this point the slices could be coverslipped in Gelvatol (Harlow and Lane, 1988) or processed for immunohistochemical labeling. Immunohistochemical labeling Tissue slices were washed in 25 mM Tris buffered saline, 0.8% NaCl, pH 7.4 (TBS) for 30 minutes. Slices were blocked in TBS containing 2% NaCl, 3% normal donkey serum (NDS), 1% cold water fish gelatin (CWFG), 1% bovine serum albumin (BSA), and 0.1% Triton-X100 (TX) for 1 hour at 4C. The slices were then incubated for 72 hours (4C) with guinea pig polyclonal anti-GFAP antibody (Advanced ImmunoChemical, Long Beach, CA) diluted 1:200 in working buffer (TBS containing 2% NaCl, 0.3% NDS, 0.1% CWFG, 0.1% BSA, and 0.25% TX). The slices were then washed 3 x 10 minutes in working buffer and then placed in working buffer (4C) containing 1:100 donkey anti-guinea pig IgG conjugated to Cy5 (Jackson ImmunoResearch, West Grove, PA). After 24 hours, the slices were washed 3 x 10 minutes in TBS and then coverslipped in Gelvatol. Imaging and analysis of dye-filled astrocytesThe Gelvatol anti-fade mounting media was allowed to set overnight. The filled astrocytes were then visualized using confocal laser scanning microscopy. The imaging was performed on a Biorad Radiance2000 microscope with a 60x oil immersion (NA=1.4) Nikon objective. Z-motor calibration was checked using z-series through 15 m fluorescent latex beads. Proper channel alignment was confirmed using z-series through both latex beads and Purkinje cell spines that had been filled with both Lucifer Yellow and Alexa 568. Image visualization and analysis was performed using the Bitplane software suite (Bitplane AG, Zurich, Switzerland).
Imaging product type
Type
Optical section
Description
optical section series of four adjacent cells; 3 injected with Alexa 568 and 1 with Alexa 488
Cutting plane
transverse
Z resolution
0.3 um
Citation Information
Eric Bushong, Maryann Martone and Mark Ellisman (1999) CCDB:28, rattus norvegicus, protoplasmic astrocyte. CIL. Dataset. https://doi.org/doi:10.7295/W9CCDB28