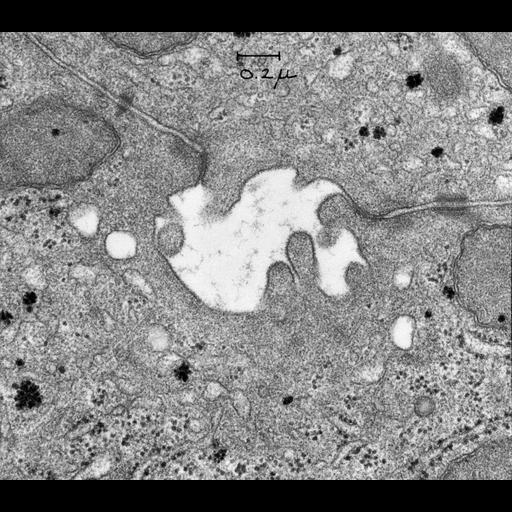
This is a view of apical domains of two adjacent hepatocytes showing the junctional complexes that attach cells to one another. The canaliculus is defined by the cell membranes of two adjacent liver cells. At the level of the tight junctions (also known as zonula occludens) the intercellular spaces are sealed, thereby preventing leakage of bile from the canaliculus. Two adherens junctions (also known as zonula adherens) and two desmosomes are seen distal (relative to the canaliculus) to each tight junction. Glycogen particles are apparent in the cytoplasm of the liver cells. First description of tight junctions and the junctional complexes between epithelial cells from many tissues. Identical labeled image available as CIL# 7599. Image published as Figure 13 in Farquhar and Palade, 1963.
Pieces of liver tissue were removed directly from anesthetized animals and immersed in a drop of fixative of 1% osmium tetroxide buffered at pH 7.6 with phosphate buffer. Tissue blocks were embedded in Epon. Sections were stained with uranyl acetate and lead hydroxide. Micrograph was taken at original magnification of 65,000 X with a Siemens Elmiskop I, operating at 60 or 80 kv, with a double condenser, and a 50 µ objective aperture. Digitization process: Lantern slide scanned at 1200 dpi in TIFF format, then reduced to 600 dpi TIFF file (3500 x 3067 pixels) prior to conversion to JPEG2000 format. Original resource provided as a 3.25 x 4 inch lantern slide by George E. Palade; original is in the Palade Collection, University of California, San Diego.
| Spatial Axis | Image Size | Pixel Size |
|---|---|---|
| X | 4800px | 0.512nm |
| Y | 4206px | 0.512nm |