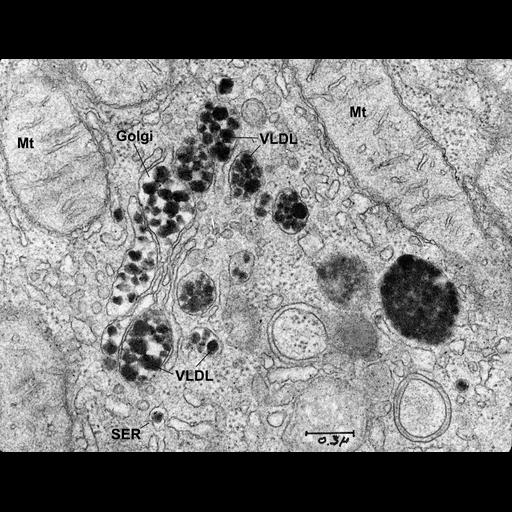
This historic micrograph features the Golgi complex from a hepatocyte of a rat treated with ethanol to stimulate lipoprotein synthesis. The cisternae are distended and loaded with very low density lipoproteins (VLDL). VLDLs are also present in the smooth endoplasmic reticulum (SER). Mitochondria (Mt) also are visible in the field. This image is part of a set of two; the images are identical, but in this one, organelles are labeled. It is also part of a set of four images focused on VLDL synthesis and secretion. This type of image stimulated the development of a method (Ehrenreich JH, Bergeron JJM, Siekevitz P, Palade GE. 1973. Golgi fractions prepared from rat liver homogenate. I. Isolation procedure and morphological characteristics. J Cell Biol. 1973;59:45-72 and a companion paper, J Cell Biol,1973;59:73-88) for isolation of Golgi fractions that took advantage of the presence of newly synthesized lipoproteins moving through the Golgi to modify the density (lighten) Golgi fractions obtained after homogenization of the cell. This method results in more enriched Golgi fractions than could be obtained without the decrease in density provided by the lipoproteins. Rats were starved overnight and then given 0.6 g ethanol per 100 g body weight in a 50% solution by stomach tube to stimulate lipoprotein synthesis and sacrificed 90 minutes later. Small blocks of liver tissue were fixed in 4% osmium tetroxide in 0.1 M cacodylate buffer pH 7.4 for 2 hours. The tissue was dehydrated and embedded in Epon. Sections were stained for 1 minute with ethanolic uranyl acetate and then alkaline lead citrate for 5 minutes. This micrograph presented here originally appeared as Fig 4 in Bergeron JJ, et al., J Cell Biol. 1973;59:73-88. The original image was created on September 14, 1972. The original 3.25 x 4 inch lantern slide was provided by George E. Palade; original is in the Palade Collection, University of California, San Diego. Digitization process: Lantern slide scanned at 1200 dpi in TIFF format, labeled in Photoshop then reduced to 600 dpi TIFF file (3500 x 2687 pixels) prior to conversion to JPEG2000 format.
| Spatial Axis | Image Size | Pixel Size |
|---|---|---|
| X | 4800px | 1.16nm |
| Y | 3685px | 1.16nm |