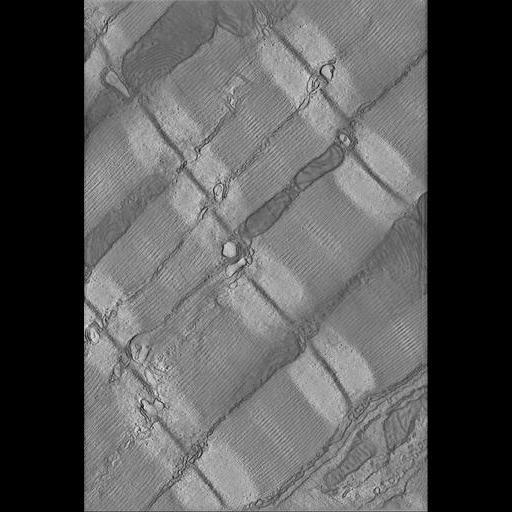
Single computed slice from a tomographic reconstruction of a 500 nm section through the middle free wall of a cardiac myocyte from the left ventricle of an adult mouse (6-8 months of age), stained with potassium ferrocyanide to increase the contrast of membrane systems. For more information see: Hayashi, T., Martone, M. E., Yu, Z., Thor, A., Doi, M., Holst, M., Ellisman, M. H. and Hoshijima, M., Three-dimensional electron microscopy reveals new details of membrane systems for calcium signaling in the heart. J. Cell Science, 2009 Apr 1;122(Pt 7):1005-13. PMID: 19295127. This image has been downsampled from the raw data image which can be accessed using the link provided to the Cell Centered Database.
Tissue was fixed with 2% paraformaldehyde and 2% glutaraldehyde in 0.15M sodium cacodylate, blocked into small pieces, post-fixed for 1-3 hours, washed 3x10min in 0.15M sodium cacodylate, then incubated in: 0.8% potassium ferrocyanide and 2% osmium tetroxide in 0.15M sodium cacodylate overnight at room temperature. Following another set of washes 2 hours-overnight in 0.15M sodium cacodylate tissue was stained en bloc with 1% uranyl acetate 30min, followed by a brief wash in DDH2O and standard dehydration and embedding. Images were gathered using a JEOL 4000, magnification of 15000.0, accelerating voltage, 400.0 kV.
| Spatial Axis | Image Size | Pixel Size |
|---|---|---|
| X | 512px | —— |
| Y | 512px | —— |