Alternate header for print version


Licensing
Attribution Non-Commercial Share Alike:This image is licensed under a Creative Commons Attribution, Non-Commercial Share Alike License. View License Deed | View Legal Code
tweet  
*CIL – Cell Image Library accession number. Please use this to reference an image.

CIL:39254*  Cite 
Description

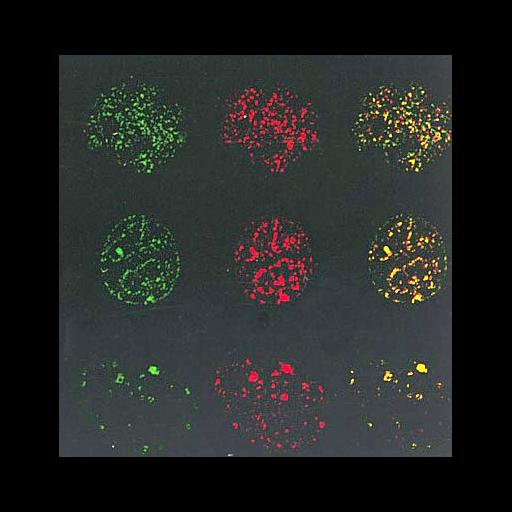
Mouse myoblast cells were transfected with GFP-PCNA (proliferating cell nuclear antigen) as a marker for replication factories, pulsed with BrdU, fixed, and immunostained with anti-BrdU. The image shows t different typical S-phase patterns displaying GFP-PCNA (left, green), BrdU (red, center) and the merged images (right). The dominant yellow coloration in the merges shows the strong localization of PCNA at replication foci. Other images in this group show the co-localization of enzymes associated with DNA replication at foci and the dynamic changes in the GFP-PCNA signal in individual foci over time.

Technical Details

C2C12 cells were transfected with GFP-PCNA and 24 hr later pulse labeled with BrdU, fixed, and stained with anti-BrdU antibodies. optical sections acquired with a Leica TCS confocal microscope. Shown are stacks of 4-5 midplane sections. See: Fig 2B in H Leonhardt et al. 2000 Dynamics of DNA replication factories in living cells. J Cell Biol 149:271-279

Biological Sources
NCBI Organism Classification
Mus musculus
Cell Type
myoblast
Cell Line
C2C12
Cellular Component
nuclear chromatin
nuclear DNA
Biological Context
Biological Process
DNA replication
DNA metabolic process
Attribution
Names
Heinrich Leomhardt
Hans-Peter Rahn
Peter Weinziert
Anje Sporbert
Thomas Cremer
Daniele Zink
M Cristina Cordoso
Published
H Leonhardt et al. 2000 Dynamics of DNA replication factories in living cells. J Cell Biol 149:271-279
Pubmed
10769021
Citation
Digital Object Identifier (DOI)
doi:10.7295/W9CIL39254
Archival Resource Key (ARK)
ark:/b7295/w9cil39254
Grouping This image is part of a group.
Imaging
Image Type
photomultiplier tube (PMT)
charge coupled device (CCD)
Image Mode
fluorescence microscopy
Parameters Imaged
fluorescence emission
Source of Contrast
distribution of epitope
Visualization Methods
Fluorescein (FITC)
Processing History
montage
Data Qualifiers
processed data
Sample Preparation
Methods
formaldehyde fixed tissue
living tissue
Relation To Intact Cell
whole mounted tissue
Dimensions
Spatial Axis Image Size Pixel Size
X 393px ——
Y 202px ——