Alternate header for print version


Licensing
Attribution Non-Commercial Share Alike:This image is licensed under a Creative Commons Attribution, Non-Commercial Share Alike License. View License Deed | View Legal Code
tweet  
*CIL – Cell Image Library accession number. Please use this to reference an image.

CIL:37932*  Cite 
Description

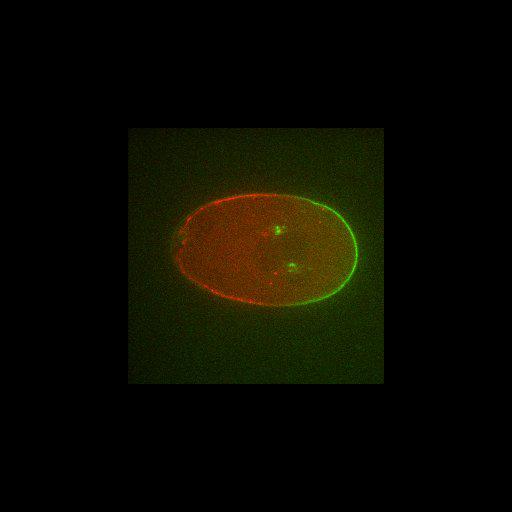
Anterior and posterior regions of a C. elegans embryo are determined by PAR protein distribution. PAR-2, shown in green marks the posterior region of the embryo and PAR-6, shown in red, marks the anterior region. The embryo was treated with the drug cytochalasin D that disrupts the actin cytoskeleton. Following drug treatment, the boundaries of PAR-2 and PAR-6 shift to the posterior as PAR-2 appears to be removed from the cortex and sequestered in cytoplasmic aggegates.

Technical Details

C. elegans embryo expressing mCherry::PAR-2 (green) and GFP::PAR-6 (red) was treated with cytochalasin-D. Embryo was made permeable by placing L4 larvae on F08F8.2(RNAi) plates for 20-24h. Imaged using an Olympus IX71 equipped with a Yokogawa spinning-disk head using a 60X-1.35 oil UPlanSApo objective, 488- and 561-nm lasers (DPSS) and an Andor iXon camera with ImageIQ. Images captured at embryo midplane at 2-2.5 second intervals. Time-lapse images correspond to Fig 4I in J Cell Biol. 2011. 193(3): 583-594.

Biological Sources
NCBI Organism Classification
Caenorhabditis elegans
Cell Type
early embryonic cell
Cellular Component
cell cortex
Attribution
Names
Nathan W. Goehring
Carsten Hoege
Stephan W. Grill
Anthony A. Hyman
Published
J Cell Biol. 2011. 193(3): 583-594.
Pubmed
21518794
Link
http://jcb-dataviewer.rupress.org/jcb/browse/...
Citation
Digital Object Identifier (DOI)
doi:10.7295/W9CIL37932
Archival Resource Key (ARK)
ark:/b7295/w9cil37932
Grouping This image is part of a group.
Imaging
Image Type
recorded image
time lapse microscopy
Image Mode
spinning disk confocal microscopy
fluorescence microscopy
Parameters Imaged
fluorescence emission
Source of Contrast
distribution of a specific protein
Visualization Methods
mCherryFP
EGFP
Processing History
unprocessed raw data
Data Qualifiers
raw, unprocessed data
suitable for spatial measurements
Sample Preparation
Methods
living tissue
Relation To Intact Cell
whole mounted tissue
Dimensions
Spatial Axis Image Size Pixel Size
X 256px 0.1521µm
Y 256px 0.1522µm