Alternate header for print version


Licensing
Attribution Non-Commercial Share Alike:This image is licensed under a Creative Commons Attribution, Non-Commercial Share Alike License. View License Deed | View Legal Code
tweet  
*CIL – Cell Image Library accession number. Please use this to reference an image.

CIL:26568*  Cite 
Description

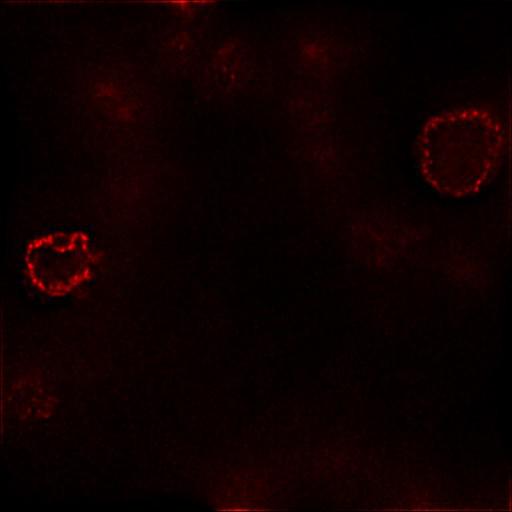
Z-series image of mouse ES cells carrying a beta-globin BAC transgene array (clone 8d) and transduced with a lentivirus containing an EGFP-lacI expression cassette. EGFP-LacI binding (green) to the 256mer lac operator repeat contained within the BAC reveals the location of the BAC transgene array relative to the nuclear periphery, highlighted by anti-nuclear pore immunostaining, and nuclear interior stained with DAPI (blue). A very high percentage of cells show part of the beta-globin transgene array touching the edge of the nuclear periphery.

Technical Details

Formaldehyde fixed cells were imaged using an IMT-2 Olympus fluorescence microscope with 60x 1.4 NA objective lens. Z-series were recorded, and the slices processed by iterative constrained deconvolution. Pixel size (xy) is 0.074 microns and z-spacing is 0.2 microns. See also: P Sinclair et al. 2010 Dynamic plasticity of large scale chromatin structure revealed by self-assembly of engineered chromosome regions. J Cell Biol 109:761-776.

Biological Sources
NCBI Organism Classification
Mus musculus
Cell Type
embryonic stem cell
Cellular Component
heterochromatin
nuclear chromatin
transgene
nuclear pore
nuclear envelope
Biological Context
Biological Process
nucleus organization
chromatin organization
Attribution
Names
Paul Sinclair
Qian Bian
Matt Plutz
Edith Heard
Andrew Belmont
Published
P Sinclair et al. 2010 Dynamic plasticity of large scale chromatin structure revealed by self-assembly of engineered chromosome regions. J Cell Biol 109:761-776
Pubmed
20819934
Link
Journal of Cell Biology
Citation
Digital Object Identifier (DOI)
doi:10.7295/W9CIL26568
Archival Resource Key (ARK)
ark:/b7295/w9cil26568
Grouping This image is part of a group.
Imaging
Image Type
charge coupled device (CCD)
Image Mode
fluorescence microscopy
Parameters Imaged
fluorescence emission
Source of Contrast
distribution of a specific protein
differences in adsorption or binding of stain
Visualization Methods
4',6-diamidino-2-phenylindole (DAPI)
EGFP
Processing History
constrained iterative deconvolution
Data Qualifiers
processed data
suitable for spatial measurements
Sample Preparation
Methods
formaldehyde fixed tissue
Relation To Intact Cell
whole mounted tissue
Dimensions
Spatial Axis Image Size Pixel Size
X 512px 0.067µm
X 512px 0.067µm
Z 60px 0.2µm